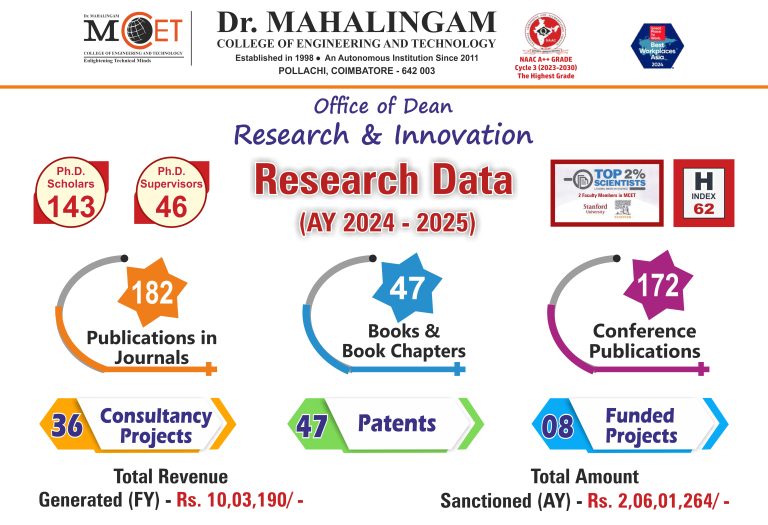
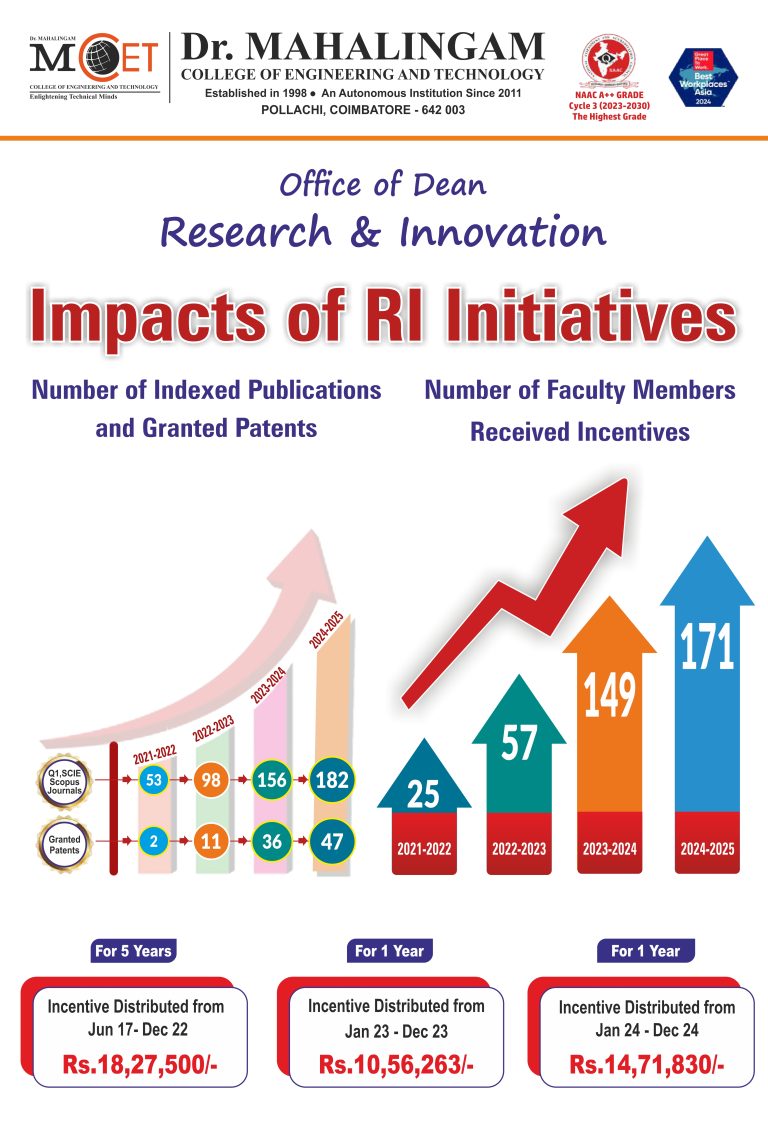
Research statistics:
MCET boasts a vibrant research program fueled by experienced faculty, strong partnerships, and a dedication to impactful solutions.
Key Highlights:
- 142 Ph.D. Scholars: Guiding students across diverse engineering fields.
- 916 Publications: Sharing knowledge and shaping research landscapes.
- 33 External funded projects: Partnering with organizations to advance research.
- 177 Consultancy projects: Applying expertise to solve industry challenges.
- 14 In-house R&D projects: Fostering internal innovation and discovery.
- 162 IPR: Translating research into tangible inventions for society.
Beyond Numbers:
- Diverse research areas: Addressing a wide range of societal needs.
- Global collaborations: Broadening perspectives and impact.
- Active student involvement: Shaping the next generation of innovators.
Academic Research
Publications
IPR
External Funded Projects
In-house R & D
Consultancy Details
Research Paper Publications:
Table Plugin
Table Plugin
| Academic Year | Number of Projects | Total Funded Amount (Rs.) |
| 2023-2024 | 4 | 1,81,78,620 |
| 2022-2023 | 4 | 1,76,33,620 |
| 2021-2022 | 6 | 6,71,800 |
| 2020-2021 | 5 | 24,69,344 |
| Total | 19 | 3,89,53,384 |
| Academic year | Number of projects sanctioned | Seed Money Provided (in Rs.) |
| 2019- 2024 | 14 | 15,95,500 |
| 2017- 2019 | 17 | 13,91,000 |
| Total | 31 | 29,86,500 |
| Academic Year | No of Consultancy Projects | Revenue Generated |
| 2023-2024 | 68 | 34,44,502 |
| 2022-2023 | 54 | 43,86,812 |
| 2021-2022 | 26 | 50,13,375 |
| 2020-2021 | 17 | 25,58,700 |
| Total | 165 | 1,54,03,389 |

